AI and workforce: Healthcare capacity planning for Australian clinics

Capacity planning in healthcare means matching staff, space, equipment and virtual service capacity to patient demand, so care stays safe and timely without wasting resources. The primary objective is simple to state and hard to deliver: the right care, at the right time, without unsafe queues or costly idle capacity. Before building any model, assemble a baseline dataset of demand, activity and the KPIs you intend to track. Everything else in this guide builds from that first step.
TL;DR:
- Capacity planning requires at least a 38% increase in monthly procedures for endoscopy services to meet wait-time targets, costing roughly 140 million dollars over five years.
- Using a KPI framework, monitoring occupancy rates daily, wait-time compliance weekly, and staff FTE weekly allows early intervention before bottlenecks develop.
- Discrete event simulation is the most effective method for hospital-wide capacity questions involving multiple resources and patient pathways, while forecasting is suitable for annual demand projections.
- Early discharge targets, ward clustering, and reducing delayed transfers of care can significantly improve patient flow and reduce emergency department length of stay without additional infrastructure.
- AI tools like Meddle enhance operational capacity by improving referral automation, reducing no-shows, and ensuring real-time practitioner availability, complementing traditional capacity models.
Table of Contents
- Scope and value of capacity planning
- Types of capacity and a KPI framework
- Analytic methods: forecasting, queuing and simulation explained
- Workforce planning: moving beyond FTEs to multidisciplinary models
- Operational interventions with evidence
- A step-by-step planning process for operational and strategic horizons
- Data, minimum datasets and pragmatic fixes for common gaps
- How AI augments simulation and practical barriers to implementation
- Validation and evaluation: how to trust a model and measure impact
- Lessons from implementing capacity plans
- How a scheduling and AI matching platform supports operational capacity
- Sources
- FAQ
Scope and value of capacity planning
Capacity planning covers four practical domains: staff (rostered and available full-time equivalent hours by role), space (beds, treatment rooms, procedure suites), equipment (imaging machines, endoscopy scopes, theatre lists) and virtual services (telehealth slots, remote monitoring capacity). Each domain has its own constraints, and a plan that only counts beds while ignoring workforce supervision limits, or that adds equipment without the staff to run it, will under-deliver.
Done well, capacity planning pays off across three dimensions. Clinically, it reduces the risk of patients waiting beyond clinically recommended timeframes. Operationally, it improves throughput and reduces bottlenecks in emergency departments (ED) and elective services. Financially, it avoids the cost of both overcapacity (idle rooms and staff) and undercapacity (blown-out waiting lists that require expensive catch-up activity later).
Modelling of endoscopy services illustrates the stakes. Leaving activity unchanged was projected to double the number of patients waiting longer than clinically recommended within five years, while meeting wait-time targets required a 38% increase in monthly procedures, at a cost of roughly $140 million over several years for the services studied.
Capacity planning typically delivers value through:
- Fewer patients waiting beyond clinically recommended timeframes, which lowers clinical risk.
- Smoother patient flow through ED and elective pathways, reducing bottlenecks and cancellations.
- Better use of existing beds, rooms and equipment before committing capital to new infrastructure.
- More predictable rostering, which reduces reliance on costly short-notice agency staff.
The scale of the problem is measurable: modelling found that without intervention, patients waiting beyond clinically recommended times would double over a multi-year period in the endoscopy services studied. That single projection is why capacity planning belongs on the executive agenda, not just in operations.
Types of capacity and a KPI framework
Planners need a shared language for capacity types and a consistent set of indicators to track them. A useful KPI framework, drawn from a systematic review of hospital-wide simulation studies, groups indicators into three categories: structural (what you have), process (how efficiently you use it) and outcome (what patients experience).

A systematic review identifying 34 KPIs used in simulation-based hospital studies found that discrete event simulation dominated the methodology (used in 83% of studies), and that departmental coverage varied, with emergency department metrics appearing in 78% of studies and inpatient metrics in 56%. That imbalance matters: many organisations track ED performance closely while under-measuring inpatient and allied health capacity.
Practical KPIs by category include:
- Structural: bed numbers, treatment room count, equipment units, staffed FTE by role.
- Process: average length of stay, bed turnaround time, time-to-admit from ED, procedure throughput per session.
- Outcome: wait-time compliance against clinically recommended targets, ED length of stay, elective surgery cancellation rate.
| Capacity type | Primary KPI | Monitoring cadence |
|---|---|---|
| Staff | Rostered FTE versus demand-adjusted FTE | Weekly |
| Space (beds, rooms) | Occupancy rate and turnaround time | Daily |
| Equipment | Utilisation rate per session | Weekly |
| Virtual services | Telehealth slot fill rate | Weekly |
Set targets against the outcome KPIs first (wait-time compliance, ED length of stay), then work backwards to the process and structural KPIs that drive them. Reviewing structural indicators monthly and process indicators weekly gives enough signal to intervene before a queue becomes a crisis, without drowning planners in noise.
Analytic methods: forecasting, queuing and simulation explained
Three analytic approaches cover most capacity questions, and each answers a different question.
Demand forecasting projects future patient volumes from historical activity, referral trends and population drivers such as ageing or chronic disease prevalence. It answers “how much demand should we expect next quarter or next year?” Inputs are historical activity data, referral rates and demographic trends; outputs are volume projections by service and time period. Forecasting is the right first tool for annual budget cycles and workforce establishment reviews, but it does not model queueing behaviour or resource interactions.
Queuing theory models how patients wait for a limited resource, capturing arrival rates, service rates and the number of servers (beds, clinicians, machines). It is well suited to steady-state questions such as “how many chairs do we need in an infusion suite to keep average waiting time under 30 minutes?” Queuing models are quick to build and interpret but struggle with variable arrival patterns, multiple patient pathways or resource interdependencies, which is where simulation takes over.
Discrete event simulation (DES) models individual patients moving through a system of queues, resources and decision points over time, capturing variability that queuing theory averages away. DES is the standard method in hospital-wide capacity studies: a systematic review of KPI use in simulation studies found DES used in 83% of the studies reviewed. It is the right tool for ED flow, elective pathway redesign and ICU capacity questions where multiple resources, staff and bed types interact.
Each method needs different inputs and suits different decisions:
- Forecasting needs historical volumes and demand drivers; use it for budget and establishment planning.
- Queuing theory needs arrival and service rates; use it for single-resource sizing questions.
- DES needs process maps, activity times and resource rosters; use it for whole-pathway redesign.
Validation matters regardless of method. A model should be checked against recent historical performance before it is trusted for “what if” scenarios, and results should be tested for sensitivity to key assumptions such as length of stay or arrival variability.
Pro Tip: Start with the simplest method that answers your question. Reach for DES only when queuing theory and forecasting genuinely can’t capture the interactions you’re trying to test.
Workforce planning: moving beyond FTEs to multidisciplinary models
Workforce planning built purely on profession-specific FTE replacement misses the point. When a physiotherapist leaves, the answer isn’t automatically “hire another physiotherapist”: it might be a different mix of allied health roles, a change in supervision structure or an adjusted scope of practice across the team.

The Australian Government’s multidisciplinary workforce planning technical guide sets out a seven-step, service-level planning model built on three principles: workforce planning should be needs-based (driven by population and patient need, not historical staffing patterns), capability-driven (matching skills to tasks rather than titles to tasks) and iterative (revisited regularly as demand and models of care shift). The guide also emphasises consumer co-design and alignment with national standards, rather than planning being done to a workforce instead of with it.
Practical application starts with three actions:
- Map role mix against need, not against last year’s roster, to identify where scope-of-practice changes could free up capacity.
- Model supervision constraints explicitly, since junior or assistant roles often have hidden capacity limits tied to supervisor availability.
- Use scenario planning tools such as the Health Workforce Planning Tool and HeaDS UPP to test different role-mix and demand scenarios before committing to a recruitment plan.
Stock-and-flow workforce models, the kind built into tools like HeaDS UPP, are best suited to long-horizon strategic questions spanning 10 to 25 years, such as how many graduates a profession needs to train. They are not designed to answer near-term operational questions like next month’s roster, which is where DES and queuing approaches take over. Maintaining both capabilities, long-horizon stock-and-flow and near-term simulation, gives planners the right tool for each time frame rather than forcing one model to do both jobs.
Operational interventions with evidence
Several interventions have been tested in simulation studies with quantified results, giving planners a prioritised, evidence-backed list rather than a menu of untested ideas.
- Set time-based early discharge targets. Discharging 80% of patients by 11am, tested in an Australian hospital setting, produced a 16% improvement in National Emergency Access Target compliance. The gain came from freeing beds earlier in the day, ahead of the afternoon admission peak, rather than simply discharging more patients overall.
- Cluster beds by ward function rather than leaving them siloed. Ward clustering, tested in discrete event simulation studies of patient flow, reduced average and total ED length of stay by 21% in one modelled scenario, because clustering let beds be shared across related specialties instead of sitting empty in one ward while another overflowed.
- Spread early discharge across shifts, not just mornings. The same simulation work found early discharge scenarios reduced ED length of stay by around 16% and cut waiting time by roughly 75% in particular tested scenarios, but the gains depended on discharge targets being distributed and operationally realistic rather than a single push on one patient cohort.
- Target delayed transfers of care before adding beds. Modelling studies repeatedly find that reducing delayed transfer of care has a larger effect on occupancy and access than an equivalent increase in bed numbers, because a bed occupied by a patient ready for discharge is not truly available capacity no matter how it is counted.
- Increase elective activity deliberately where modelling shows a gap, accepting the cost trade-off. Endoscopy modelling found that reaching 95 to 98% wait-time compliance required a 38% increase in monthly procedures, at an estimated $140 million over five years for the services studied, a cost that is easier to justify to an executive team when it is set against the cost of doubling long-wait patients if nothing changes.
A 21% reduction in ED length of stay from bed clustering alone shows how much can be gained from reorganising existing capacity before requesting new beds, according to discrete event simulation research on patient flow.
A step-by-step planning process for operational and strategic horizons
A practical capacity plan moves through five phases, each with its own deliverable and owner.
- Baseline. Collect demand, activity and KPI data for the past 12 to 24 months. Deliverable: an agreed dataset and a KPI dashboard. Owner: the data lead.
- Model. Build the forecasting, queuing or DES model appropriate to the question, and validate it against recent historical performance. Deliverable: a validated model with documented assumptions. Owner: the data lead, working with clinical owners.
- Test. Run scenarios against the model (added beds, changed discharge targets, role-mix changes) and quantify expected impact. Deliverable: a shortlist of interventions ranked by expected effect. Owner: clinical owners and operations, jointly.
- Implement. Roll out the chosen intervention with a clear start date and communication plan. Deliverable: an implementation schedule and staff briefing. Owner: operations, with executive sponsor sign-off.
- Monitor. Track the KPIs identified at baseline against the intervention’s expected effect, and adjust. Deliverable: a monthly monitoring report. Owner: the data lead, reporting to the executive sponsor.
Short-term operational plans, covering rostering, bed management and weekly demand smoothing, should run on a three to 24-month horizon and be reviewed at least quarterly. Medium-term strategic plans, covering workforce establishment, facility expansion and major service redesign, run on a two to five-year horizon and should be revisited annually as part of the iterative, needs-based approach recommended in the multidisciplinary workforce planning technical guide.
Pro Tip: Assign a single executive sponsor before the modelling starts, not after. Interventions with quantified benefits still stall without someone senior accountable for the implementation phase.
Data, minimum datasets and pragmatic fixes for common gaps
Forecasting and simulation models are only as good as the data feeding them. At minimum, planners need patient-level activity records (arrival time, service start and end time, discharge time), resource rosters (staff on duty by role and shift) and demand records (referrals, presentations, waiting list additions).
Allied health data is a common gap: many services track medical and nursing activity closely but have patchy records for physiotherapy, occupational therapy or speech pathology sessions. A pragmatic fix is to use referral volume as a proxy for demand where session-level activity data is not yet captured, while flagging the proxy clearly in any model documentation so decision-makers understand its limits.
| Dataset | Minimum fields | Common gap |
|---|---|---|
| Patient activity | Arrival, service start/end, discharge time | Allied health session-level detail |
| Staff roster | Role, shift, supervision level | Casual and locum shift capture |
| Demand records | Referral date, service type, urgency | Self-referral and direct-access pathways |
Build a simple operational dashboard covering the outcome and process KPIs from your framework, refreshed daily for ED and bed metrics and weekly for elective and allied health metrics. That cadence catches emerging problems early without creating a reporting burden nobody has time to read.
How AI augments simulation and practical barriers to implementation
AI is increasingly used alongside simulation rather than as a replacement for it. A systematic review of combined AI and simulation applications in healthcare process optimisation, covering 22 studies mostly published between 2021 and 2025, found that supervised learning, DES and agent-based methods together can improve resource allocation and reduce waiting times, with AI most useful for demand prediction, triage-probability calibration and parameter estimation inside a simulation model.
Practical AI contributions include:
- Demand prediction, using historical and real-time data to forecast presentations more precisely than trend-based forecasting alone.
- Triage-probability calibration, helping simulation models reflect how patients are actually prioritised rather than assuming uniform urgency.
- Parameter estimation, tuning length-of-stay and service-time inputs from live data rather than static historical averages.
The same review flagged integration and standardisation as the main barriers: AI models need strong, consistent data pipelines and upfront validation, and without that, results can mislead rather than inform. Governance and clinician trust are equally important. A model clinicians do not understand or trust will not change practice, no matter how accurate its outputs.
The safest path is a small, well-scoped pilot: pick one pathway (an ED stream or an elective list), validate the AI-informed outputs against recent real outcomes before using them for decisions, and involve clinical staff in reviewing the model’s assumptions from the start.
Pro Tip: Treat the pilot’s validation step as non-negotiable. An AI-augmented model that hasn’t been checked against recent real performance is a guess with a confident interface.
Validation and evaluation: how to trust a model and measure impact
A model earns trust through checkpoints, not through confidence in its outputs. Before using any forecast, queuing model or simulation for decisions, check its fit against recent historical performance, run it through an adequate warm-up period so start-up artefacts do not distort results, and test sensitivity to key assumptions such as length of stay and arrival variability.
- Compare modelled outputs against at least one recent historical period before trusting scenario results.
- Run sensitivity analysis on length-of-stay and arrival-rate assumptions, since small changes there often drive large differences in output.
- Involve clinical stakeholders in reviewing model assumptions, not just the final results.
- Watch for administrative or “virtual” bed counts that look like added capacity on paper but do not reflect physical or staffing constraints.
- Always test downstream dependencies: adding upstream capacity without checking ICU or subacute capacity can simply move the bottleneck rather than remove it.
A simple evaluation template tracks the baseline KPI value, the target set at the modelling stage, and the measured value at 3, 6 and 12 months after implementation, reported against the intervention’s expected cost. That structure gives an executive team a clear, comparable answer to “did it work?”
Lessons from implementing capacity plans
The plans that stick share one trait: they start small and show a measurable win before asking for organisation-wide buy-in. Pick one ward, one clinic or one pathway, run the intervention, and let the improved KPI make the case for scaling up.
Speed and stakeholder ownership pull against each other more often than planners expect. Moving fast without clinical and operational staff genuinely on board produces a plan that looks good in a model and dies at the roster meeting. Slowing down to build that ownership costs weeks upfront and saves months later.
Success at 6 to 18 months rarely looks dramatic. It looks like a KPI dashboard nobody argues with any more, a discharge target that has become routine rather than a project, and a bed-clustering arrangement staff defend rather than resist.
— Taylor
How a scheduling and AI matching platform supports operational capacity
Capacity models tell you what your beds, staff and equipment should be doing. Meddle helps make sure the demand side matches that plan, by getting patients to the right practitioner faster and keeping intake moving without the administrative drag that distorts scheduling data in the first place.
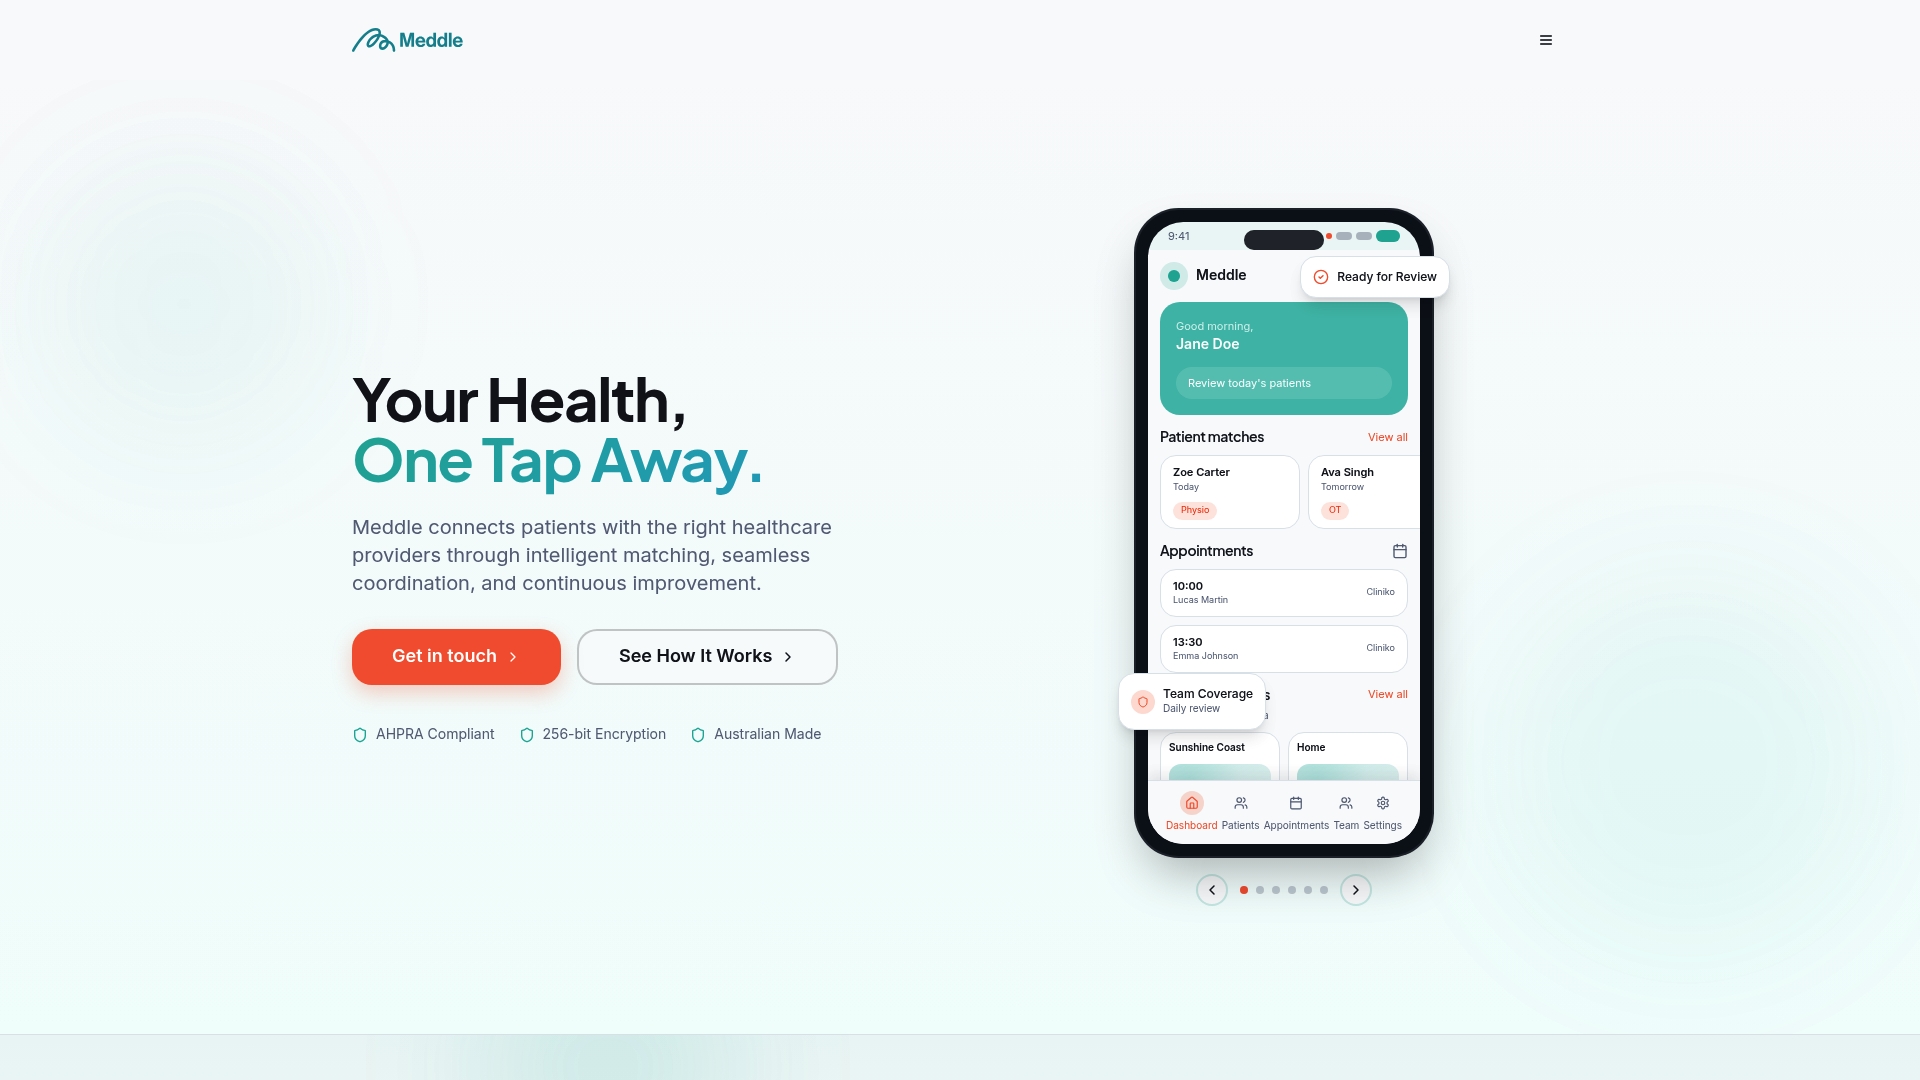
Meddle’s AI-powered matching connects patients with appropriate allied health practitioners across physiotherapy, occupational therapy, psychology, speech pathology, dietetics, exercise physiology, podiatry and other allied health categories, using real-time availability lookup and referral automation to smooth intake rather than let it pile up. For a clinic running a capacity plan, that matters in three concrete ways:
- Reduced no-shows and faster referrals, which keeps the demand data feeding your KPI dashboard cleaner and more reliable.
- Real-time availability and instant booking, which spreads bookings across practitioners rather than concentrating them at a few points of contact.
- Secure messaging and practice management tools, which cut the admin load that often eats into clinical capacity you have already modelled.
Meddle does not replace demand modelling, workforce planning or facility redesign, and it is not a substitute for the DES and forecasting work covered above. It sits alongside that work as the operational layer that keeps referrals, bookings and communication moving in line with the plan you have already built.
Clinics can review plans, including SMS Notifications and CRM Integration at $50 AUD per month per practice, on the Meddle pricing page.
Sources
- Multidisciplinary workforce planning: technical guide (Australian Government Department of Health, 2026)
- Combined applications of artificial intelligence and simulation for healthcare process optimisation (PubMed, 2025)
- Identification of KPIs in simulation-based studies for hospital efficiency (PubMed, 2026)
- Endoscopy demand modelling and waiting‑list projections (QUT ePrints)
- Discrete-event simulation to model patient flow and capacity interventions (PubMed)
FAQ
What is an example of capacity planning?
A common example is modelling how many endoscopy procedures a service must run each month to keep wait times within clinically recommended targets. One such study found a 38% increase in monthly procedures was needed to sustain 95 to 98% wait-time compliance in the services examined.
What are the stages of the care planning process?
Most capacity planning processes move through baseline data collection, modelling, scenario testing, implementation and ongoing monitoring. Each stage has a distinct deliverable, from an agreed KPI dataset at baseline through to a monthly monitoring report once an intervention is live.
What are the four pillars of capacity in healthcare?
Healthcare capacity is generally described across four types: staff, space, equipment and virtual services. Each has its own KPIs and constraints, and a workable plan accounts for all four rather than focusing on beds or staff alone.
What is the best tool for capacity planning?
The right tool depends on the question: demand forecasting suits budget cycles, queuing theory suits single-resource sizing, and discrete event simulation suits whole-pathway redesign, with DES used in 83% of hospital-wide simulation studies reviewed in one systematic analysis. For long-horizon workforce questions, stock-and-flow tools like the Health Workforce Planning Tool and HeaDS UPP are the standard choice.