
Demand forecasting in an allied-health clinic means estimating how many patients will need which service, in which location and at what time, so you can match practitioner hours to that need. The most reliable starting point is your own referral and booking history. Structured intake data is what makes that history usable, and it is what Meddle is built to produce.
This guide explains the method in plain steps, the data worth using, how to turn a forecast into capacity, and how to check it against what actually happens.
TL;DR
- Forecast demand from referrals received, not only from appointments booked. Referrals you lose never show up in booking data.
- Start with a baseline from data you already hold, then adjust it for known drivers such as population growth, ageing and seasonal patterns.
- Convert demand into practitioner hours by specialty, location and appointment type, then test two or three scenarios rather than chasing one precise number.
- Review the forecast against actuals every month and record your assumptions so you can see why it moved.
- Structured intake and matching data from Meddle gives you a cleaner baseline. The pilot is free for 30 days.
Table of Contents
- What demand forecasting means for an allied-health clinic
- Why forecasting matters in allied health
- The data worth using
- Forecasting methods, from simple to advanced
- A nine-step process, scaled to a clinic
- Turning a forecast into capacity
- Checking and updating the forecast
- Where Meddle fits
- Our perspective
- FAQ
- Sources
What demand forecasting means for an allied-health clinic
In hospitals and pharmaceutical supply chains, demand forecasting is a statistical discipline with large data sets. In a clinic with five to thirty practitioners, the question is simpler: how many new patients will ask for physiotherapy, occupational therapy, psychology, speech pathology, dietetics or podiatry over the next quarter, and do you have the hours to see them?
It helps to separate two terms. Forecasting estimates the demand. Planning is what you do about it: rostering, hiring, opening new session times. The Australian Department of Health’s Multidisciplinary Workforce Planning Technical Guide says demand estimation should make explicit the link between population need and service demand, and that it is meant to inform workforce decisions rather than produce a precise forecast. That is a useful standard for a clinic: a forecast that is roughly right and clearly explained beats a precise number nobody trusts.
Why forecasting matters in allied health
Allied health has long been described as under-measured. An Australian paper titled Allied health growth: what we do not measure we cannot manage reports that inadequate workforce data limits planning for future workforce needs, practitioner distribution, training and scope of practice. The same problem exists at clinic level. If you do not record what was asked for, you can only plan from what you happened to book.
Three decisions depend on a forecast:
- Hiring and rostering. Do you need another psychologist two days a week, or more sessions from the practitioners you have?
- Location and travel radius. Is demand clustering in suburbs or regions you cover only partly, for example in home-visit areas?
- Appointment types. Are initial assessments outpacing follow-ups, which changes how you set session lengths?
For a broader view of how this fits with day-to-day operations, see our guide to healthcare capacity planning for Australian clinics.
The data worth using
The Department of Health guide recommends three moves: define the services or care pathways you are forecasting, establish a baseline from readily available information, then adjust it using evidence-based assumptions such as population growth, ageing, disease prevalence and planned changes to how services are delivered. For a clinic, that translates into the following.
Your own records
The core inputs are:
- Referrals received per week, by source (GP, email, web form, self-referral) and by service.
- Referrals that did not become a booked first appointment, and the reason.
- Appointments delivered by type (initial, review, group, home visit).
- Waiting time from referral to first appointment.
- Cancellations and no-shows.
The most commonly missing item is the second one. When referrals arrive across inboxes, fax-to-email, web forms and phone messages, the ones that are never answered leave no trace. A forecast built only on bookings then understates true demand and quietly locks in the shortfall.
Population and local drivers
The department’s guide names ageing, population growth and disease prevalence as standard adjustments. For a clinic, apply them locally. A practice near several aged-care facilities will see different growth in physiotherapy and dietetics demand than one near a new housing estate with young families. Our pages on allied health for aged care clients and dementia care at home show how those referral pathways look.
Calendar and external signals
A 2020 Australian study of South-East Queensland emergency departments, forecasting daily patient presentations, considered year, month, day of week, public holidays and maximum daily temperature as predictors. You are unlikely to model temperature, but the principle applies: demand has a seasonal and weekly shape. Physiotherapy referrals often differ around sport seasons, and many clinics see quieter weeks around school holidays and the end of the year. Record this shape rather than assuming it.
A 2025 Australian study, evaluating forecasting models for health service demand, used daily internet searches for depressive symptoms and monthly GP-visit and antidepressant-expenditure data as proxies for mental-health service demand. It found search data added short-run predictive information. That is research-level modelling, but it illustrates a clinic-level point: signals that arrive before a booking, such as referral volumes, are better predictors than the bookings themselves.

Forecasting methods, from simple to advanced
Searchers often ask for the four main methods of forecasting. In practice, clinics choose from a ladder, and the first rung is enough for most.
| Method | What it does | When a clinic would use it |
|---|---|---|
| Simple baseline | Averages the last 12 months of referrals by service, by month | Any clinic with a year of records |
| Time series | Looks at referrals over time to find trend and seasonality | Clinics with two or more years of weekly data |
| Regression | Links demand to drivers such as population, season or referrer activity | Groups with several sites or services |
| Machine learning | Detects complex patterns across many variables | Large networks with substantial data and analytical staff |
The 2020 Queensland study compared generalised additive models, generalised linear models, multiple linear regression, seasonal ARIMA and random forest. The 2025 study found machine-learning models had lower mean squared error than autoregressive forecasts in its setting. These results come from large public-sector data sets. For a clinic, the lesson is to start simple and add complexity only when your data supports it.
What a time series means in a clinic
A time series is just a count recorded at regular intervals, such as new referrals per week for occupational therapy. Plot it and look for three things: a long-run direction (growing or flat), a repeating pattern (term-time dips, winter peaks) and one-off spikes (a new GP relationship, a closed competitor, a funding change). Once you can describe those three, you can project the next quarter by taking the trend, applying the seasonal pattern, and noting any known events.
The Department of Health’s Psychology Supply and Demand Model methodology is a national example of this type of work: it uses a generalised linear model with year, patient age group, sex and patient and provider location as inputs, plus population projections to estimate the population at risk. Notice that location is a core input. Clinic forecasts that ignore where the demand is will mislead.
A nine-step process, scaled to a clinic
A peer-reviewed article, Effective demand forecasting in 9 steps, recommends assembling historical data, analysing trends, identifying drivers and benchmarks, modelling existing conditions, setting assumptions, creating a baseline and testing sensitivity to changes in assumptions. Here is that logic as a routine you can run in an afternoon each quarter.
- Define the service lines. Physiotherapy, OT, psychology and so on, split by appointment type and by funding stream such as NDIS, Medicare-referred or private.
- Gather 12 to 24 months of referral and appointment data. Pull referrals first, bookings second.
- Plot weekly volumes by service line. Mark known events: a practitioner leaving, a new site, a school break.
- Identify drivers. Which GPs or coordinators send the most? Which suburbs? Which referral channels convert?
- Set a baseline. The last 12 months, adjusted for trend and season.
- Write down assumptions. For example, one more regular GP referrer, or a new aged-care contract.
- Build two or three scenarios. Low, expected and high.
- Convert to hours. Multiply forecast new patients by the average sessions per episode and session length.
- Compare with capacity and decide. Roster, recruit, or change session types.
The department’s guide supports the scenario step: it recommends scenario-based thinking when data quality is limited or a new care model has no prior data, testing a small number of plausible futures and documenting assumptions.
A worked example
Suppose your clinic received 60 psychology referrals a month over the past year, and 42 became first appointments. The gap is not demand you can ignore: 18 referrals a month were lost, delayed or sent elsewhere. If you forecast from the 42 bookings, you plan for 42. If you forecast from 60 and expect 5 per cent more next quarter, you plan for 63. At an average of six sessions per episode and one hour per session, that is 378 practitioner hours a month compared with 252. These figures are illustrative, not from any clinic, but the arithmetic shows why the referral count matters more than the booking count.

Turning a forecast into capacity
A forecast has value only when it changes a roster. A 2019 Australian study of orthopaedic and neurosurgical outpatient services, using simulation modelling, examined patient journeys, capacity constraints and professional mix. It projected that if demand growth continued and capacity stayed unchanged over five years, waiting lists would grow across the participating sites, and it recommended expanding service scale and maximising physiotherapist-led services to meet waiting-time targets.
The clinic-sized lesson: check capacity by the same dimensions you used to forecast demand.
- Specialty. Do you have enough speech pathology hours, not just enough hours overall?
- Travel radius. Can the practitioners who cover the north side take the north-side referrals?
- Appointment type. Are long initial assessment slots available, or only 30-minute reviews?
When demand outruns one practitioner, matching referrals to the next best fit matters as much as hiring. Allocation rules based on specialty, travel and appointment type reduce the time a referral sits waiting. For practical guidance on how clinics use dashboards to track this, read our practice analytics guide, and see how patient self-scheduling can release capacity at the front desk.
Workforce models that translate projected activity into staffing needs also depend on how people work together, and team dynamics affect whether a roster plan holds. Some practices use a personality framework for teams when discussing how to distribute workloads across practitioners.
Checking and updating the forecast
A forecast that is never compared with reality drifts. A monthly routine keeps it honest:
- Compare forecast referrals with actual referrals by service line.
- Note the gap in percentage terms and the likely cause, such as a new referrer or a closure.
- Revisit the assumptions you wrote down. Which ones changed?
- Adjust the next quarter, and keep the old version for comparison.
The nine-step article also recommends sensitivity testing: change one assumption at a time and see how much the hours move. If a 10 per cent change in referrals from one GP group shifts your psychology roster by a full day, that relationship deserves attention. Our guide to building specialist networks with PHNs explains how to deepen those referrer relationships, and the patient growth guide covers attracting and retaining new patients.
Where Meddle fits
A forecast is only as good as the intake data behind it. Meddle turns referrals from GPs, email and web forms into structured intake, triage and practitioner matching on specialty, travel radius and appointment type. Each referral becomes a consistent record, which gives you a cleaner baseline for the steps above: referrals received by source, by service and by location, rather than a pile of inbox messages.
Pricing is A$40 per user per month ex GST, or A$400 per user per year ex GST (two months free). Every user pays the same, including admins and coordinators. Everything is included, with no add-ons, and there is a free 30-day pilot. Patient data is hosted in Sydney.
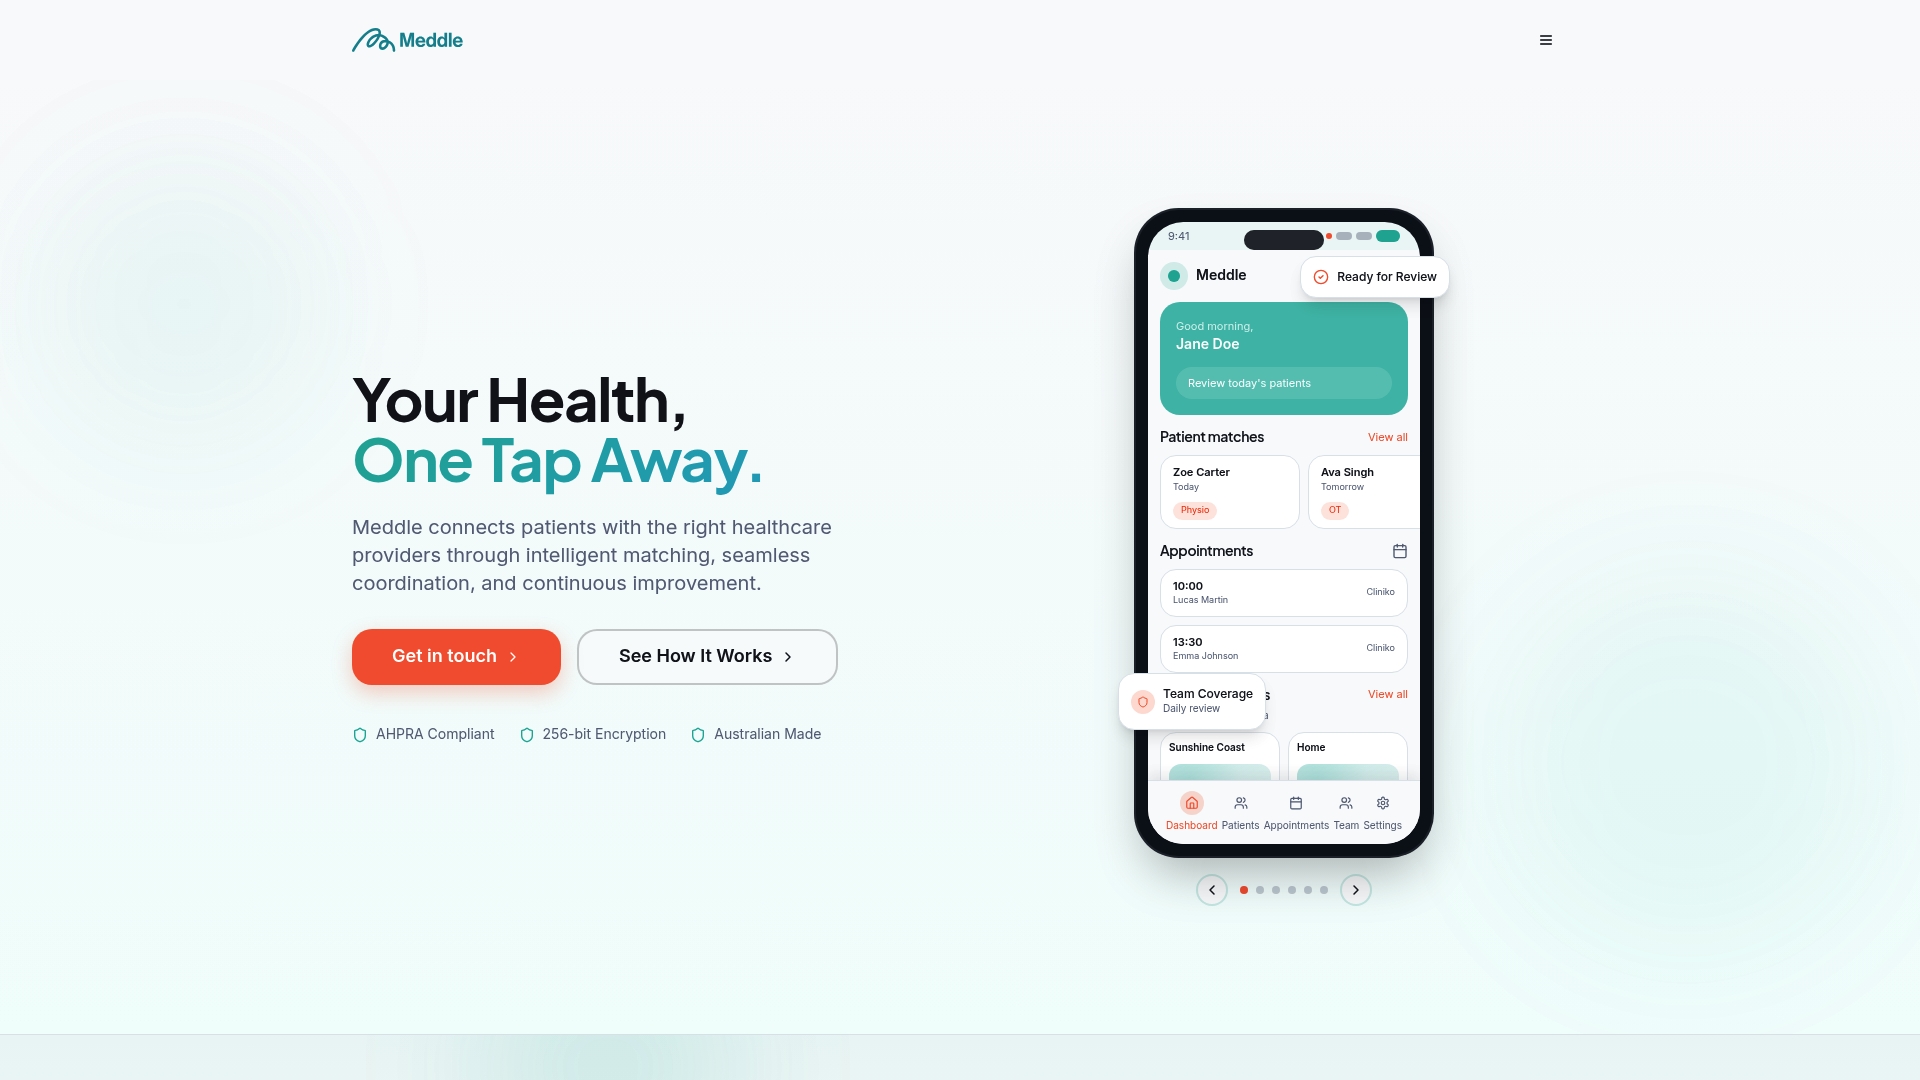
See how triage and practitioner matching works, how the referral to booked appointment flow runs, or how it supports NDIS referrals for allied-health clinics.
Our perspective
Most clinics we talk about forecasting with assume they need a data scientist. They do not. They need a reliable record of what was asked for.
Directories list who is out there. We look at the person: what they need, where they are and which practitioner fits. When that information is captured at intake, the forecast comes almost for free, because you can count demand by specialty, location and appointment type without rebuilding it from inboxes.
That is why we built matching and intake as one workflow. Fewer lost referrals means less admin for your team and a truer picture of the demand your clinic can serve.
Taylor
FAQ
How is demand forecasting different from demand planning?
Forecasting estimates how much demand to expect. Planning is the set of actions you take in response, such as rostering, recruiting and changing session types. The Department of Health guide treats demand estimation as an input to workforce decisions, so the two work together.
How much data does a clinic need to start?
Twelve months of referral and appointment records is enough for a seasonal baseline. Two years lets you see whether a pattern repeats. If you have less, use scenarios and document your assumptions, as the Department of Health guide advises.
Should I forecast from referrals or from appointments?
Use referrals first. Appointments only record the demand you converted, while referrals record what was asked for. Comparing the two also shows where referrals are lost between receipt and booking.
How often should we update the forecast?
Compare forecast with actuals monthly and rebuild the baseline each quarter. Update sooner when something changes, such as a new referrer, a new site or a practitioner leaving.
To see how structured intake could feed your own forecast, book a 30-minute demo.
Sources
- Multidisciplinary Workforce Planning: Technical Guide, Department of Health, 2026
- Allied health growth: what we do not measure we cannot manage
- Forecasting daily counts of patient presentations in emergency departments, 2020
- Evaluating forecasting models for health service demand, 2025
- Psychology Supply and Demand Model methodology paper
- Effective demand forecasting in 9 steps, 2004
- Implementation of simulation modelling to improve service planning, 2019
Recommended
- Overbooking Strategy for Allied-Health Clinics: A Safe Approach
- Best healthcare scheduling software for allied health clinics
- AI and workforce: Healthcare capacity planning for Australian clinics
- Appointment Slot Optimisation for Allied-Health Clinics
This article is general information for healthcare businesses and isn’t legal, clinical or privacy advice. Check current requirements with the relevant regulator or a qualified adviser.