No-Show Analytics for Allied Health Clinics

No-show analytics means counting missed appointments the same way every month, then splitting the result by practitioner, appointment type, day, lead time and funding type until a pattern shows. Start with one clear rate, add four or five cuts, change one thing at a time and compare before and after. You don’t need a data science team. You need clean statuses in your appointment book and a monthly habit.
This guide is for clinic owners and practice managers. It covers definitions, the formula, Australian benchmarks, the patterns worth checking, how to test a fix and how to handle patient data responsibly.
TL;DR
- Define a no-show and a late cancellation in writing, then record them as separate statuses. A rate is only useful if everyone counts the same way.
- Calculate it monthly: no-shows divided by scheduled appointments, times 100. Break it down by practitioner, appointment type, day and time, new versus returning patients, and funding type.
- Australian clinics report widely different rates, from around 5% to over 18% depending on service and location, so compare yourself with your own past results first.
- Change one thing at a time, such as reminder timing, and compare the months before and after. Keep what works and roll back what doesn’t.
- Use only the patient information you need, and de-identify it where you can.
Table of Contents
- What counts as a no-show
- How to calculate your no-show rate
- What the Australian evidence says about typical rates
- The cuts that turn a rate into a decision
- Signals that tend to predict a missed appointment
- What a no-show actually costs
- How to test whether a fix works
- Perspective
- Privacy and fairness when you analyse attendance data
- Where Meddle fits
- A monthly routine you can keep
- FAQ
- Sources
What counts as a no-show
Before any maths, agree on the words. Definitions differ across the sector, which is why two clinics can report very different rates for the same behaviour.
One published benchmarking study defines a no-show as a patient who did not attend and gave no prior notification, and counts a cancellation only when it happens within the same day the appointment was scheduled. One Sydney private hospital’s policy treats a no-show as failure to arrive for a scheduled appointment, and a late cancellation or reschedule as a change with less than 48 hours’ notice.
For your clinic, three statuses are usually enough:
- Attended. The patient was seen.
- No-show (DNA). The patient did not arrive and gave no notice.
- Late cancellation. The patient cancelled inside your policy window, commonly 24 or 48 hours.
Write the window into your cancellation policy so patients and staff read it the same way. If you charge fees, the policy needs to be clear, visible and reasonable. Legal commentary on Australian no-show fees advises spelling out what counts as a no-show, for example not arriving within a set number of minutes of the start time. We cover policy wording in more depth in our cancellation policy templates.
How to calculate your no-show rate
The formula is simple:
No-show rate = no-show appointments ÷ total scheduled appointments × 100
Here is an illustrative example, not real clinic data. Your clinic had 800 appointments still booked at their start time in a month. Forty were recorded as no-shows. 40 ÷ 800 × 100 gives a 5% no-show rate. If a further 30 people cancelled inside your window, report that as a separate late-cancellation rate of 3.75% on the same base. Keeping the two apart tells you whether your problem is people forgetting or people changing their minds.

Counting traps that distort the number
Most bad no-show data comes from inconsistent recording, not from patients. Check for these:
- Deleted bookings. If reception deletes a missed appointment instead of marking it, it vanishes from the rate.
- No-shows logged as cancellations. A patient who never rang is a no-show, however the diary was tidied afterwards.
- Mismatched date filters. Pull no-shows and cancellations for the same date range.
- Group sessions. Count each participant, not each session.
- Telehealth. Make sure a missed video or phone consult is recorded with the same status as a missed face-to-face one.
At the end of each month, sample 20 appointments and check each status against the appointment book and any notes before you report a figure. It takes ten minutes and protects every decision that follows.
What the Australian evidence says about typical rates
There is no single benchmark, and you shouldn’t chase one. Published Australian figures vary because the services, locations and definitions differ.
- A 2025 costing study of two metropolitan hospital physiotherapy clinics estimated non-attendance at 8% and 10% (2018 to 2021 data).
- A Queensland Health study of more than 2.9 million specialist outpatient appointments found non-attendance of 9.1% for telehealth against 7.9% for in-person. The authors concluded telehealth does not address the most common reasons for missing appointments, which are forgetfulness or confusion about appointment details.
- A tier 2 public pain unit reported allied health no-shows of 27.12% before a booking system change, which shows how high rates can run in a particular setting.
The lesson: your own trend matters more than anyone else’s average. A clinic that moves from 9% to 6% has learned something. A clinic that merely matches a published figure has not.
The cuts that turn a rate into a decision
A single clinic-wide percentage hides the cause. Split the same data several ways and look for the pocket where the problem concentrates. Practice-software guidance for Australian clinics suggests tracking by location, practitioner, appointment type, day and time, and funding type, such as private, NDIS, Medicare, DVA or WorkCover. Early Monday slots, first appointments, one site or one funding type are common culprits.
| Cut | Question it answers | Possible action |
|---|---|---|
| Practitioner | Is one diary much higher than others? | Review how that practitioner’s patients are booked and reminded |
| Appointment type | Are initial assessments worse than reviews? | Send intake forms and directions earlier |
| Day and time | Do Monday mornings or late afternoons fail more? | Move high-risk patients to steadier slots |
| New vs returning | Is the first visit the weak point? | Add a confirmation step after booking |
| Funding type | Does one payer group miss more? | Check whether reminders and policies reach them clearly |
| Referral source | Do some referral channels convert poorly? | Tighten intake at the point of referral |
| Lead time | Do far-ahead bookings fail more? | Offer earlier slots or add a mid-wait check-in |
Run these monthly. Only act on a pattern that repeats across two or three months, because small clinics can see large swings from a handful of appointments.
Signals that tend to predict a missed appointment
You can go further than averages. An Australian analytics write-up from a technology consultancy notes that the most useful predictors are mostly logistical rather than clinical: the time between booking and appointment (often the strongest single signal), prior attendance history, number of reschedules, day and hour, appointment type and a travel proxy such as distance band.
You can check these in a spreadsheet export without any modelling:
- Lead time. Group appointments by days between booking and visit and compare the no-show rate in each band. Our guide to appointment lead time shows how to read this.
- Attendance history. Flag patients with a previous no-show. A history of missed appointments is a strong marker of future ones.
- Reschedules. An appointment moved twice is a different risk from one that has never moved.
- Distance. Patients travelling farther can miss more often. If your clinic matches patients to practitioners by travel radius, this is worth tracking.
One caution on fairness. Research on a public dental clinic found that non-attendance clustered in certain groups, including people in low socio-economic areas and some cultural groups. That is a reason to look for barriers such as transport, language and cost, and to offer help. It is not a reason to deny anyone a booking.
Setting up a simple risk flag
If you want a practical version of prediction, keep it manual. Pick two or three signals from your own data, for example a previous no-show plus a booking made more than three weeks ahead, and have reception make a confirmation call for those appointments. Then measure whether the flagged group’s no-show rate falls. The same consultancy notes that the effort should match the cost: a phone call costs more than a text, so reserve it for the appointments most likely to be missed.
What a no-show actually costs
The lost session fee is only part of it. The 2025 physiotherapy costing study found projected annual non-attendance costs as high as A$114,827 for a single clinic. It also found the most expensive scenario was an internally referred patient whose missed appointment was converted to a phone appointment, at a mean A$113 per appointment. The cost includes the administrative and clinical effort of handling the miss.
To put your own number on it, multiply your monthly no-shows by your average session fee, then add the staff minutes spent rebooking, calling and filling the gap. Our No-Show Cost Calculator does the arithmetic. For capacity, see how appointment utilisation links missed sessions to lost clinical time.
How to test whether a fix works
Analytics only pays when it changes behaviour and you can tell whether it worked. Use a plain before-and-after routine:
- Record the baseline rate for the last three months.
- Change one thing, such as sending reminders at 7 days and 24 hours.
- Run it for at least two to three months.
- Compare the rate, using the same definitions and the same cuts.
- Keep it if it helps, roll it back if it doesn’t, and share the result with practitioners.
Two Australian public-health examples show what a measurable result looks like:
- The NSW Government Behavioural Insights Unit reported that behaviourally informed SMS reminders sent seven days and 24 hours before appointments produced a 33.7% reduction in missed appointments at two NSW hospitals, in a four-month pre-post study of outpatient clinics.
- A Central Coast pain unit that introduced a new booking system reported allied health no-shows falling from 27.12% to 11.93%, and mean administrative contacts per patient dropping from 1.4 to 1.15, in its published study.
These are hospital settings, so treat them as evidence that reminders and booking design can move the number, not as a promise for your clinic. Test your own version and let your data decide. Our guides on SMS appointment reminders and reducing patient no-shows cover the practical side.
Perspective
Most clinics we speak to don’t have a no-show problem so much as a visibility problem. The diary shows who missed. It rarely shows where the appointment came from, how long the patient waited, how far they travelled or whether the match was right in the first place.
We built Meddle around that idea. It turns referrals from GPs, email and web forms into structured intake, triage and practitioner matching on specialty, travel radius and appointment type. When a referral arrives complete and the patient is matched to a suitable practitioner nearby, you have fewer loose ends to chase and cleaner data to analyse later.
Our view is that no-show analytics should start at intake, not at the missed appointment. Directories list who is out there. We aim to connect the person to the right care and carry their story forward, so the information you need to understand attendance is captured once and stays with the referral.
Start small: one rate, five cuts, one change a quarter. The clinics that make progress are the ones that look at the same report every month.
Taylor
Privacy and fairness when you analyse attendance data
Attendance data is personal information, and often health information. The Office of the Australian Information Commissioner’s guide to data analytics and the Australian Privacy Principles recommends using de-identified data where possible, collecting only what is reasonably necessary for your functions, being transparent about your data practices and considering privacy impacts and fairness.
In practice:
- Report no-show patterns at group level. A monthly table by day, practitioner and appointment type doesn’t need patient names.
- Keep any individual risk flag inside the clinical and admin team that needs it.
- Tell patients in your privacy policy and intake forms how their information is used.
- Ask where your software provider hosts data. Meddle hosts patient data in Sydney.
If you are unsure how the Privacy Act applies to a specific project, speak with a privacy lawyer or the OAIC.
Where Meddle fits
If you are tired of rebuilding the same spreadsheet each month, Meddle can take over the front end of the process. It structures referrals at intake, triages them and matches patients to practitioners by specialty, travel radius and appointment type. It integrates with your practice management system and writes back to your CRM, so your admin team spends less time re-keying details.
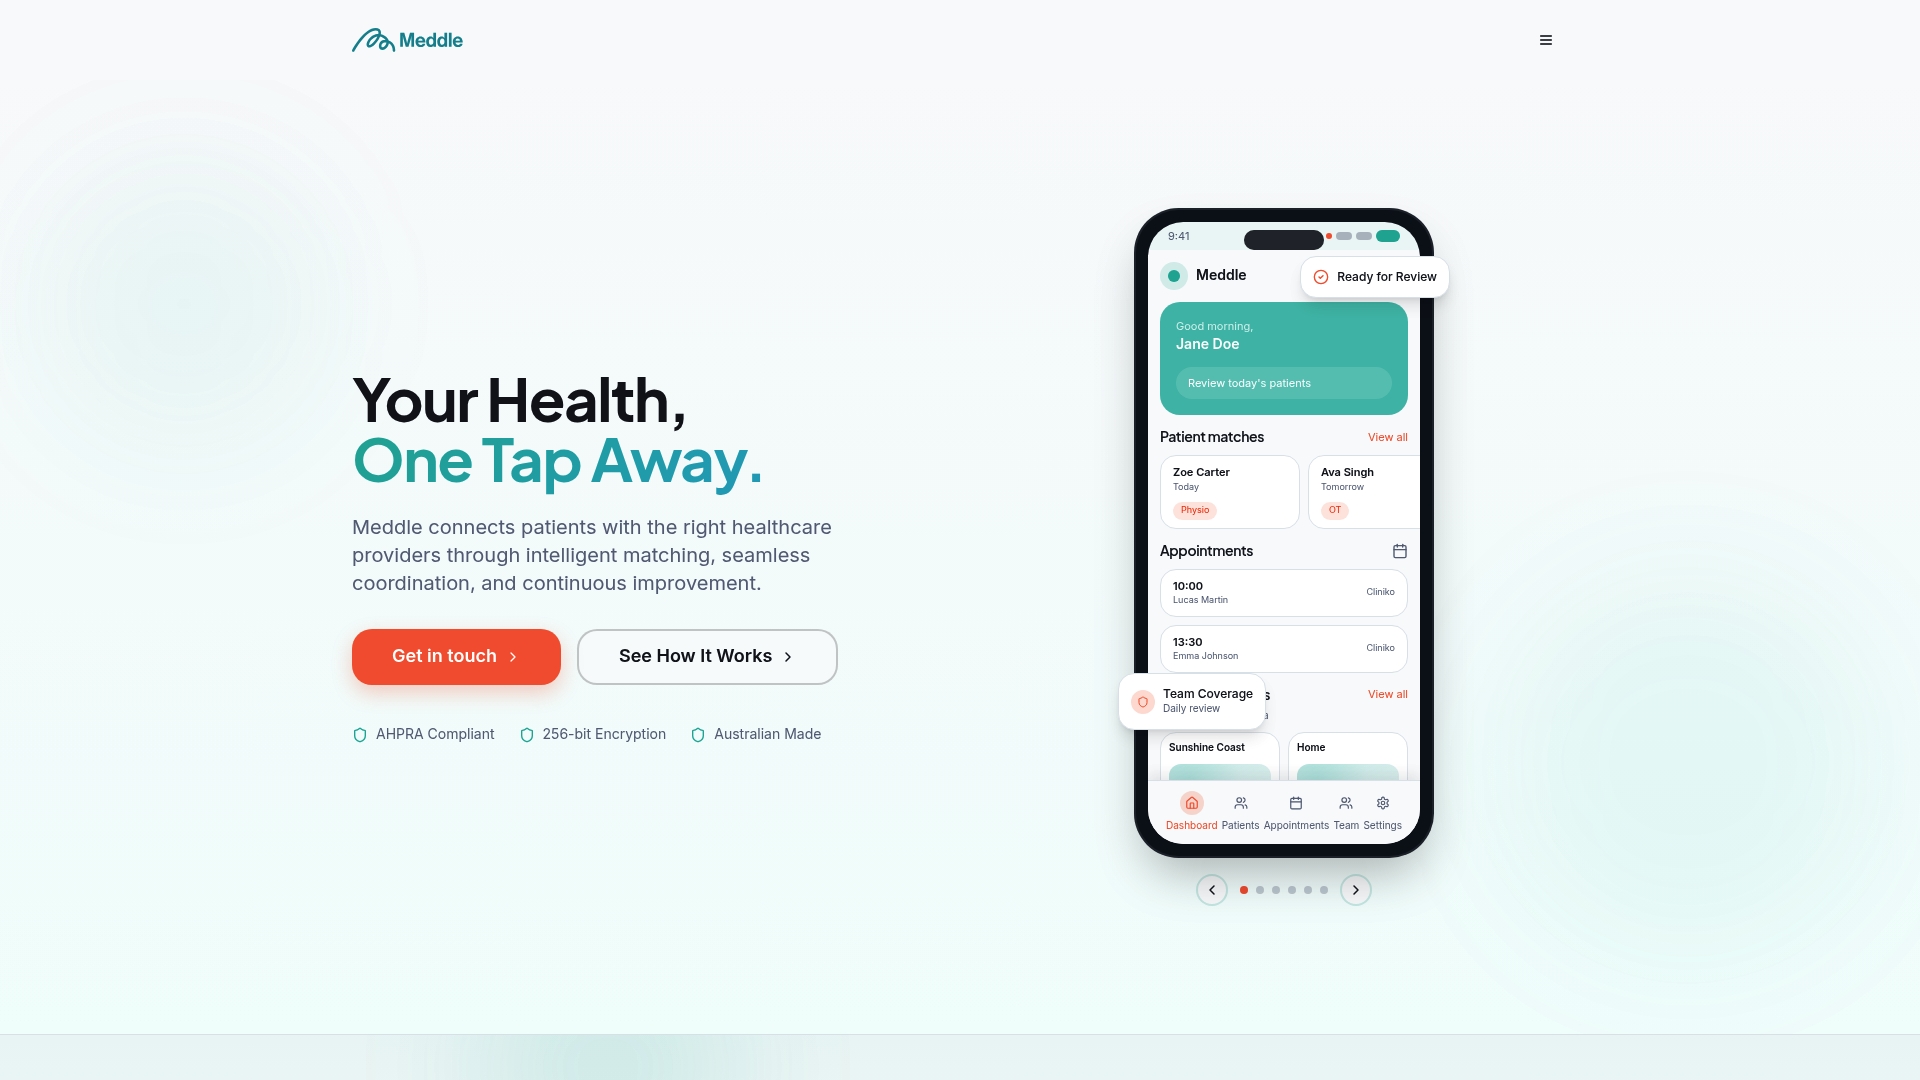
The optional Appointments add-on includes a shared diary, and Telehealth is available as a separate add-on. There is no minimum spend and a free 30-day pilot, so you can see how it fits your intake before committing. Explore how Meddle matches patients to care, or see our Progression practice management page.
A monthly routine you can keep
A reliable routine beats an ambitious dashboard. Block 45 minutes in the first week of each month:
- Export last month’s appointments with status, practitioner, type, booking date and funding type.
- Audit a sample of 20 statuses against the diary and notes.
- Calculate the no-show rate and the late-cancellation rate separately.
- Cut the data by practitioner, appointment type, day and time, new versus returning, and funding type.
- Compare with the previous three months and with the month before your last change.
- Decide on one action, and note the date it starts.
- Share the one-page result with practitioners and reception.
Several Australian practice-software guides recommend first appointments for special attention, because they are often the highest risk. Sending clear directions, what to bring, intake forms in advance and a reminder that explains what will happen is a low-cost change worth testing early. For your gaps, a plan to fill last-minute cancellations and better appointment slot optimisation help recover the sessions you can’t prevent losing.
FAQ
What is the difference between a no-show and a cancellation?
A no-show is a patient who doesn’t attend and gives no notice. A late cancellation is a patient who cancels inside your policy window, commonly 24 or 48 hours. Some definitions treat cancellations differently, so write yours into your policy and track the two rates separately.
What is a good no-show rate for an allied health clinic?
There is no single target. Published Australian figures range from about 8% to 10% in hospital physiotherapy clinics, and far higher in some outpatient settings. Compare yourself with your own previous months, and by practitioner and appointment type, rather than with another clinic’s average.
Do SMS reminders reduce no-shows?
They can. The NSW Behavioural Insights Unit reported a 33.7% reduction in missed hospital appointments with behaviourally informed SMS reminders sent seven days and 24 hours ahead. Make replies useful, so patients can confirm, reschedule or cancel easily, and measure your own before-and-after result.
Can I charge a no-show fee?
No-show fees are generally lawful in Australia, but enforceability depends on how the fee is set, disclosed and applied. Make the policy clear, visible and reasonable, and define what counts as a no-show. For your specific wording, ask a lawyer or your professional association.
Is it okay to analyse patient attendance data?
Yes, within the Privacy Act and the Australian Privacy Principles. The OAIC advises collecting only what is reasonably necessary, using de-identified data where possible and being transparent with patients. Report patterns at group level wherever you can.
Ready to see how structured intake and matching could clean up your attendance data? Book a 30-minute demo.
Sources
- Key Performance Indicators Benchmarking Study (PPSAPTA)
- Cancellation Policy, East Sydney Private Hospital
- No-Show Fees: Legal Setup for Australia, Sprintlaw
- Cost of physiotherapy non-attendance at a metropolitan hospital, PMC
- No observed reduction of non-attendance rate in telehealth, Queensland Health study
- Implementation of a New Booking System to Reduce No-Shows, Central Coast Local Health District
- Reduce No-Shows in Your Clinic With Halaxy Reminders, Unified Computing
- Predicting appointment no-shows, PicNet
- The effectiveness of SMS Reminders, Australasian Journal of Information Systems
- Using behaviourally-informed reminders cuts missed hospital appointments, NSW Government
- Guide to data analytics and the Australian Privacy Principles, OAIC
Recommended
- No-Show Cost Calculator
- Appointment Slot Optimisation for Allied-Health Clinics
- Appointment utilisation: how allied-health clinics measure and lift it
- Clinics: Cut Missed Appointments up to 33.7% with SMS and Booking Fixes
This article is general information for healthcare businesses and isn’t legal, clinical or privacy advice. Check current requirements with the relevant regulator or a qualified adviser.